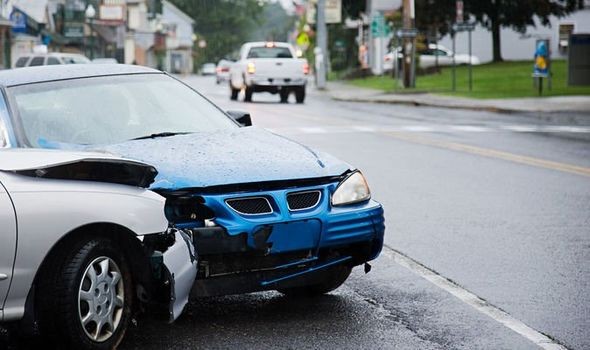
Of the nine different states All Star Drivers Education offers, these top few are the most dangerous to drive in. How safe are the drivers in your state?
At All Star we do everything in our power to ensure the safety of our students. Although we work to keep you or your child safe, we can’t protect you from other drivers on the road. Take a look at these statistics to see how your state compares. Below is a list of the states in which we offer drivers education from the most dangerous (#1) to the safest (#50).
#4. Arizona
– Fatalities per 100 million vehicle miles: 1.53 (-63% change since 1975)
– Total fatalities: 1,010 (+51.0% change since 1975)
– Percent of fatalities related to speeding: 28.2% (#25 highest of all states)
– Percent of fatalities with a driver over .08 BAC: 28.2% (#22 highest of all states)
– Deaths by road user type: 36.6% car, 31.0% light trucks, 2.4% large trucks, 20.1% motorcycles, 9.8% other or unknown
In Arizona they offer both a Arizona Defensive Driving class and a Arizona Permit Waiver class.
#8. Oklahoma
– Fatalities per 100 million vehicle miles: 1.44 (-57% change since 1975)
– Total fatalities: 655 (-13.0% change since 1975)
– Percent of fatalities related to speeding: 22.4% (#38 highest of all states)
– Percent of fatalities with a driver over .08 BAC: 22.1% (#46 highest of all states)
– Deaths by road user type: 40.1% car, 37.5% light trucks, 5.2% large trucks, 15.9% motorcycles, 1.4% other or unknown
#17. Texas
– Fatalities per 100 million vehicle miles: 1.29 (-68% change since 1975)
– Total fatalities: 3,642 (+8.0% change since 1975)
– Percent of fatalities related to speeding: 27.2% (#28 highest of all states)
– Percent of fatalities with a driver over .08 BAC: 39.5% (#2 highest of all states)
– Deaths by road user type: 44.8% car, 37.5% light trucks, 2.8% large trucks, 12.7% motorcycles, 2.2% other or unknown
#32. Indiana
– Fatalities per 100 million vehicle miles: 1.05 (-65% change since 1975)
– Total fatalities: 858 (-24.0% change since 1975)
– Percent of fatalities related to speeding: 21.9% (#39 highest of all states)
– Percent of fatalities with a driver over .08 BAC: 26.5% (#32 highest of all states)
– Deaths by road user type: 46.2% car, 32.4% light trucks, 3.4% large trucks, 16.4% motorcycles, 1.6% other or unknown
Of a total of 435 drivers killed, Indiana reported a blood alcohol concentration for only 115. At 26%, Indiana’s reporting rate is the lowest in the country and compares to a high of 100% for Washington D.C. Nationally, the rate was 65%.
#37. Michigan
– Fatalities per 100 million vehicle miles: 0.95 (-69% change since 1975)
– Total fatalities: 974 (-45.0% change since 1975)
– Percent of fatalities related to speeding: 25.2% (#34 highest of all states)
– Percent of fatalities with a driver over .08 BAC: 27.4% (#30 highest of all states)
– Deaths by road user type: 45.5% car, 33.9% light trucks, 1.2% large trucks, 17.7% motorcycles, 1.6% other or unknown
#39. Ohio
– Fatalities per 100 million vehicle miles: 0.93 (-66% change since 1975)
– Total fatalities: 1,068 (-40.0% change since 1975)
– Percent of fatalities related to speeding: 27.2% (#29 highest of all states)
– Percent of fatalities with a driver over .08 BAC: 27.5% (#29 highest of all states)
– Deaths by road user type: 50.3% car, 29.6% light trucks, 3.0% large trucks, 15.9% motorcycles, 1.2% other or unknown
#42. Wisconsin
– Fatalities per 100 million vehicle miles: 0.89 (-73% change since 1975)
– Total fatalities: 588 (-37.0% change since 1975)
– Percent of fatalities related to speeding: 31.6% (#17 highest of all states)
– Percent of fatalities with a driver over .08 BAC: 33.8% (#7 highest of all states)
– Deaths by road user type: 43.5% car, 35.2% light trucks, 2.7% large trucks, 15.8% motorcycles, 2.9% other or unknown
#49. Minnesota
– Fatalities per 100 million vehicle miles: 0.63 (-79% change since 1975)
– Total fatalities: 381 (-49.0% change since 1975)
– Percent of fatalities related to speeding: 29.7% (#22 highest of all states)
– Percent of fatalities with a driver over .08 BAC: 27.6% (#28 highest of all states)
– Deaths by road user type: 41.3% car, 35.8% light trucks, 1.2% large trucks, 18.0% motorcycles, 3.7% other or unknown
With Ohio being our largest turnout, we are glad to see this state on the safer side. Luckily, over the years, road safety laws have tightened while our technology has advanced. Driver safety precautions across the US have increased, resulting in fewer deaths from car crashes.
Arizona, the state with the highest fatality to mile(s) driven ratio, is the one state we offer a defensive driving course. This course is for Adults who have received a traffic violation to further educate themselves and ultimately take points off their record. As a company, we are proud to offer this course to a state that struggles with speeding and obeying the traffic laws.
At All Star Driver Education our mission is to keep our roads safe. We teach your teens to anticipate and stay safe from the dangers of the road. You will drive over a million miles in your lifetime, let's keep you safe with quality driver education.


